Ematic Analytics Dashboard
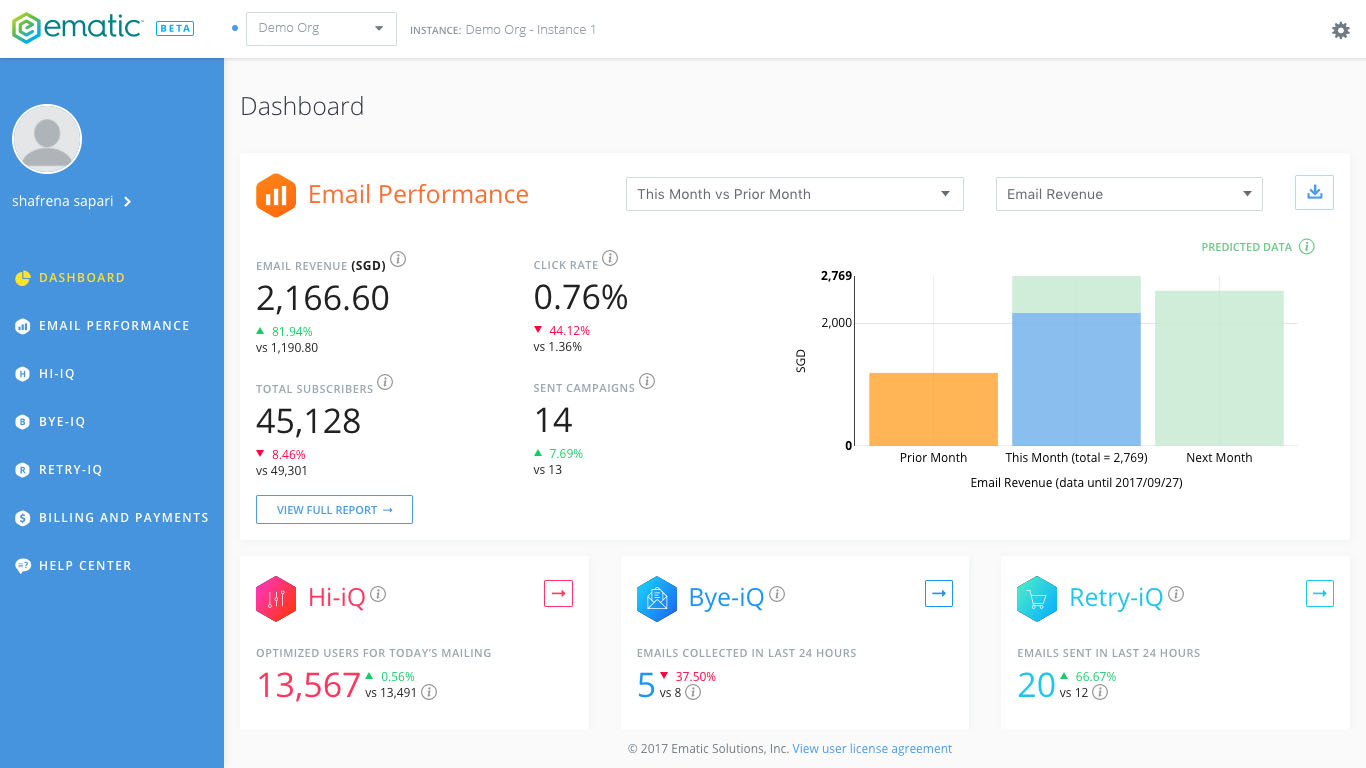
On the Dashboard page is where all your important numbers like Email revenue, Click rate, total subscribers and sent campaigns are projected along with the performance of your Ematic products.
Info: To ensure that all numbers are projected, do check that you have your Google Analytics and ESP integrated. Learn how to integrate your Google Analytics here.
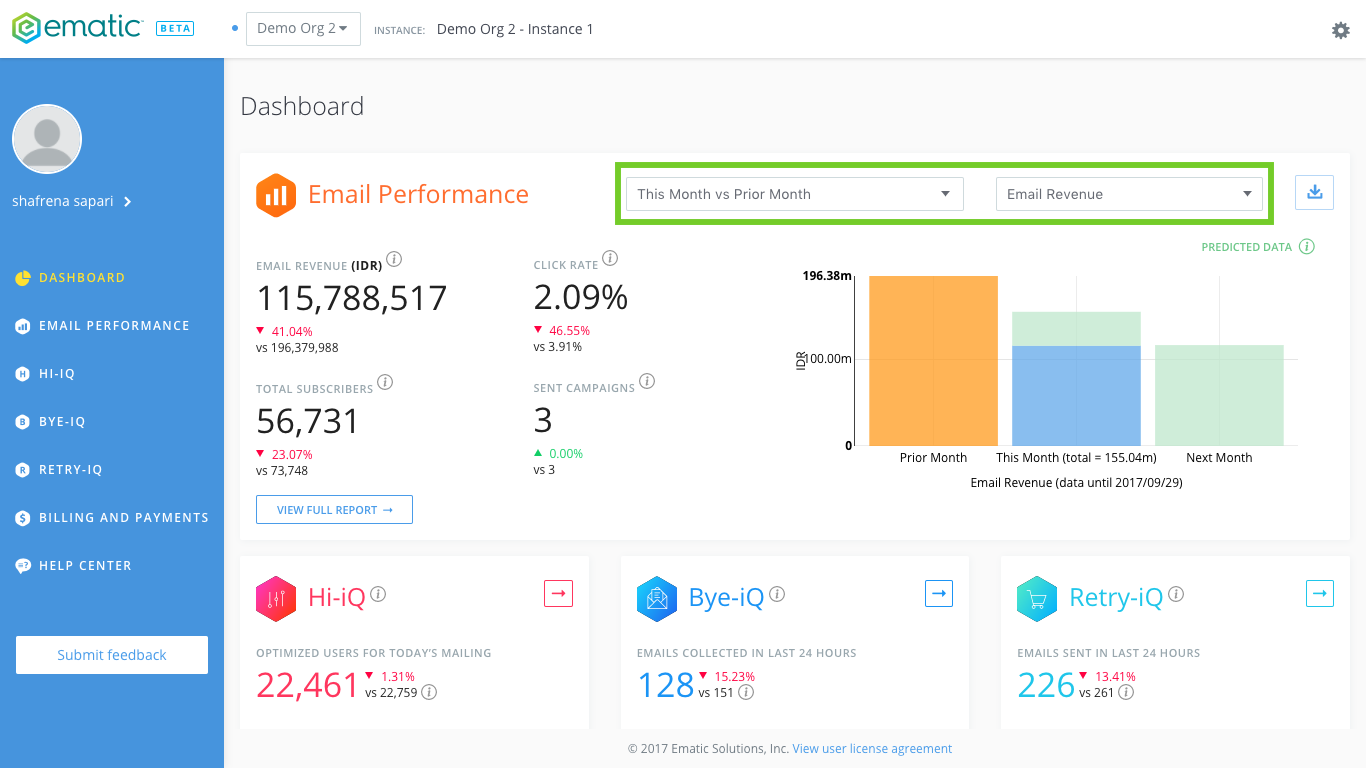
You can project different data points by clicking on the drop down menu of data points and preset time frame. The graph will be updated along with the predicted data. Based on previous trends performance, predicted data is projected on the graph in green. Want to improve and beat the predicted data, contact your Customer Success Manager or support@ematicsolutions.com.
On this tab, you can also:
- Export data to CSV
- Print or save data to PDF
Export data to CSV
- Click on the download icon on the top right.
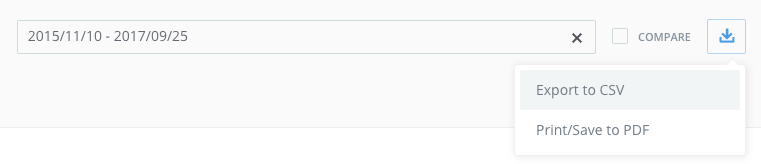
- Click on Export to CSV and your report can be downloaded
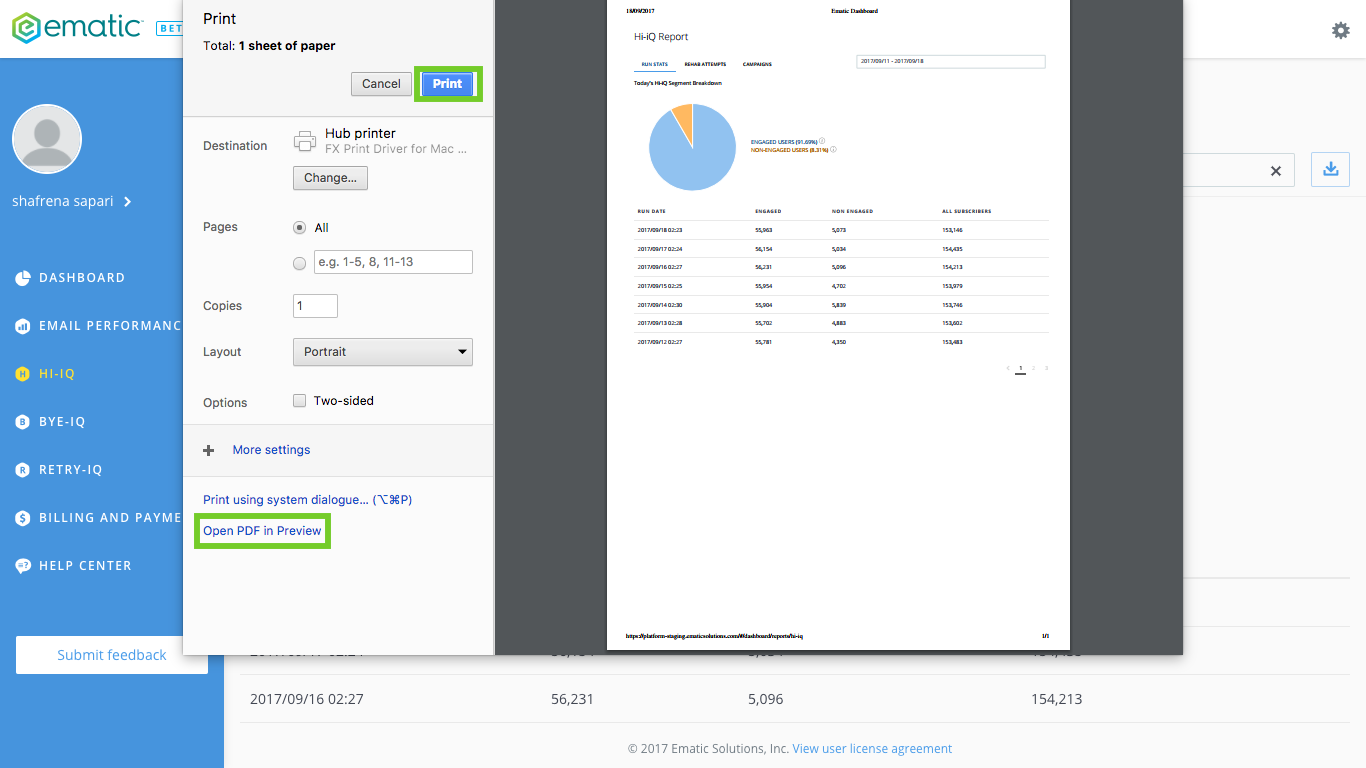
Print or save data to PDF
- Click on the download icon on the top right.
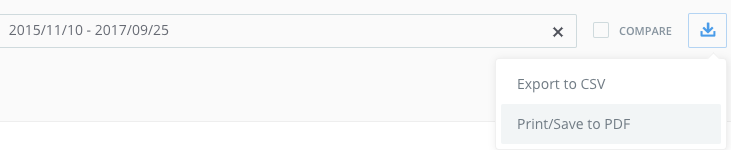
- Click on the ‘Print/save to PDF’
- Select the printer or ‘open PDF in preview’