Campaign Report
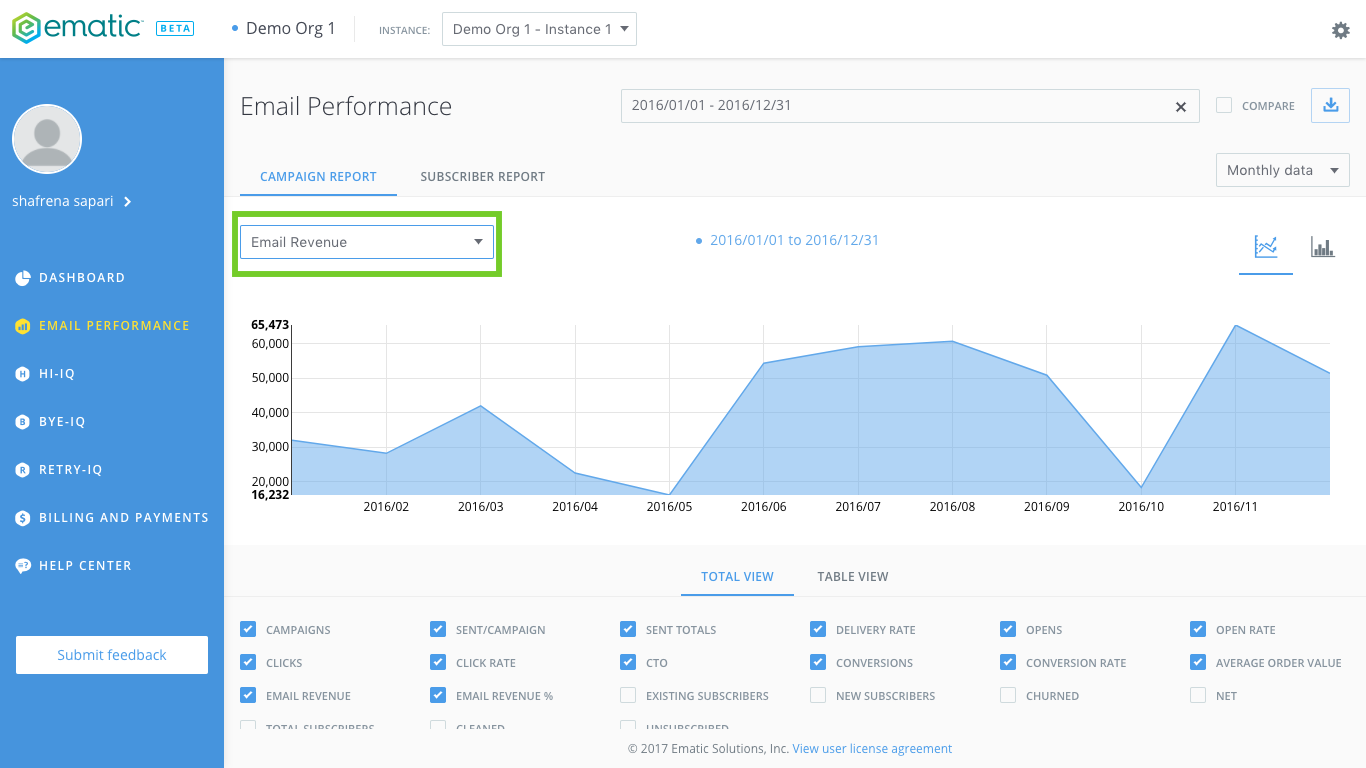
The Campaign Report tab allows you to view email revenue and other relevant data points. In this tab you can:
- Customised time frame
- Compare data
- Predict data
- Export to CSV
- Print/Save to PDF
- Line graph or Bar chart or Pie chart
- View relevant data in total view or table view
- Other data points
Customised time frame
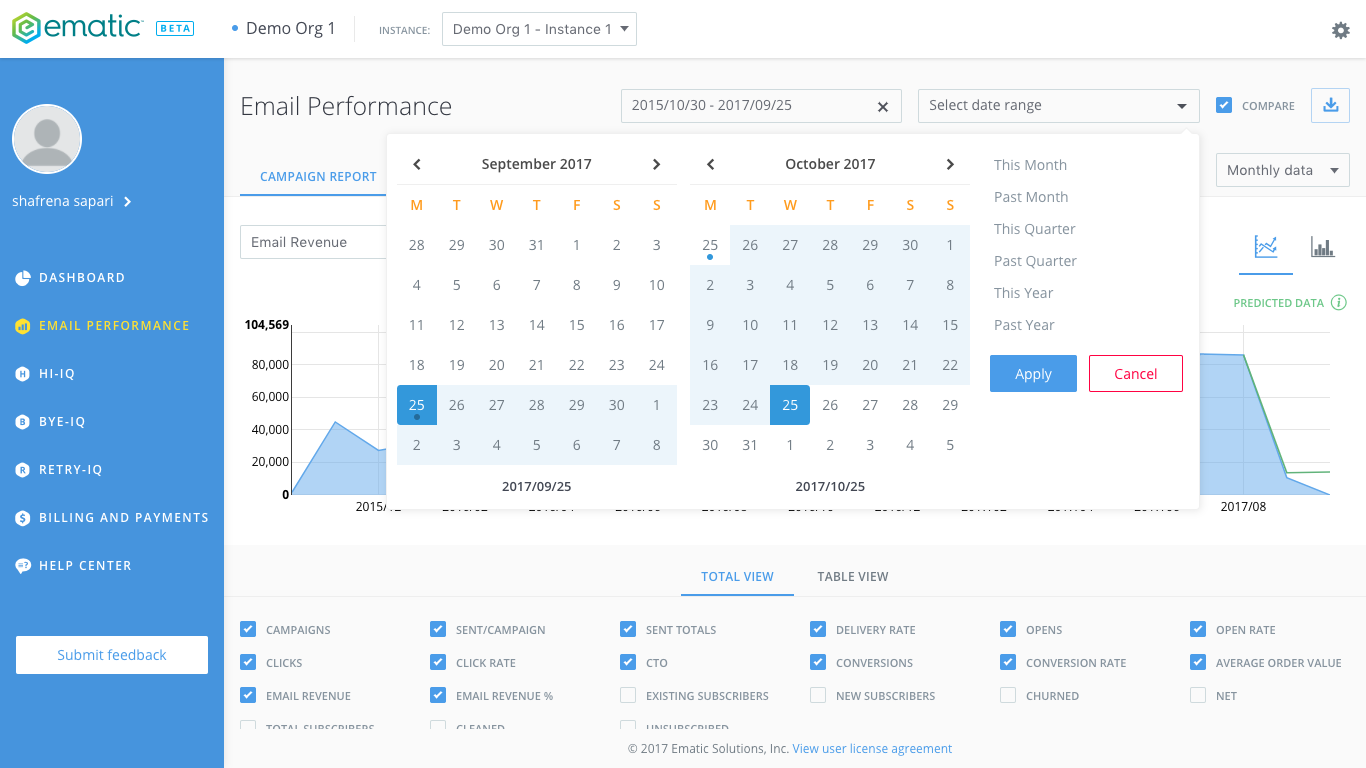
- Click on the date drop down menu.
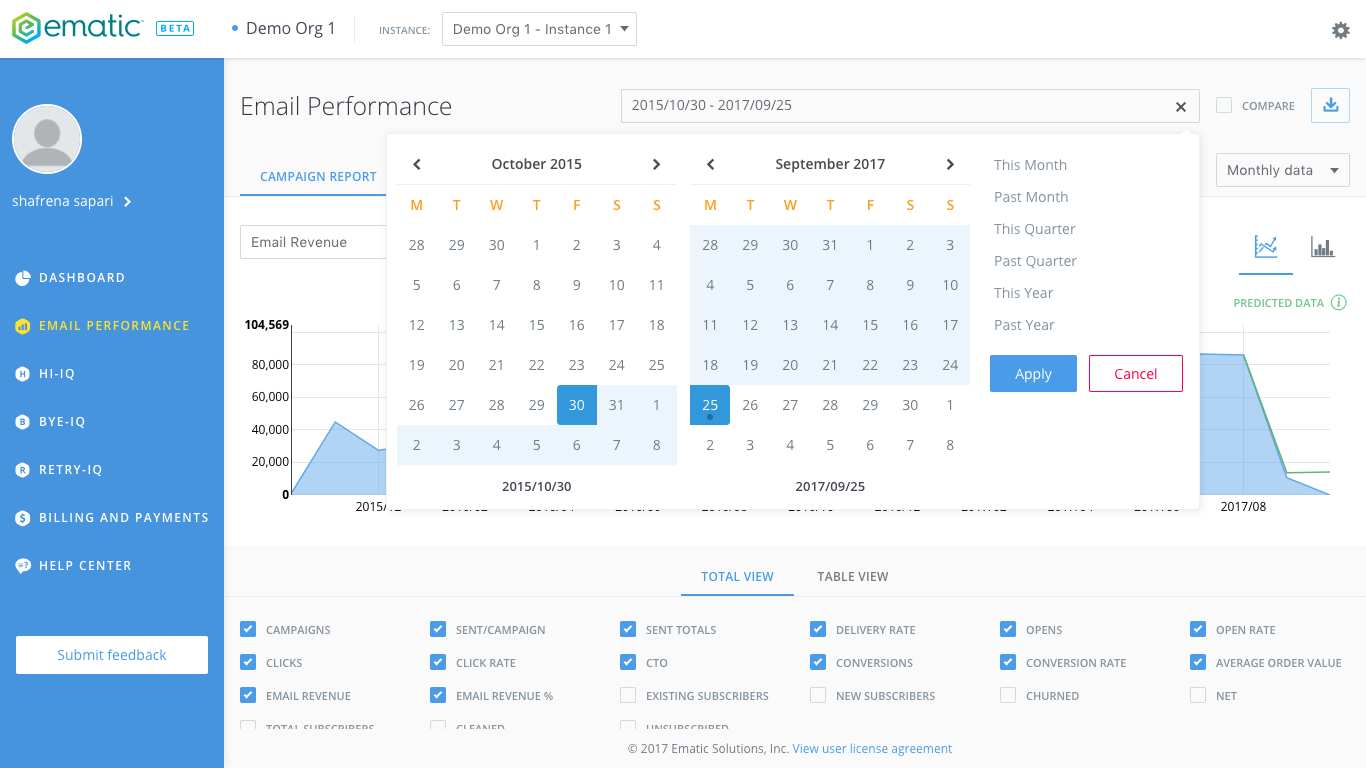
- Click on the start date on the calendar on the right and the end date on the calendar on the right. You may also select preset time frames by selecting it:
- this month
- past month
- this quarter
- past quarter
- this year
- past year
- Click ‘Apply’ and the graph will updated.
Compare data
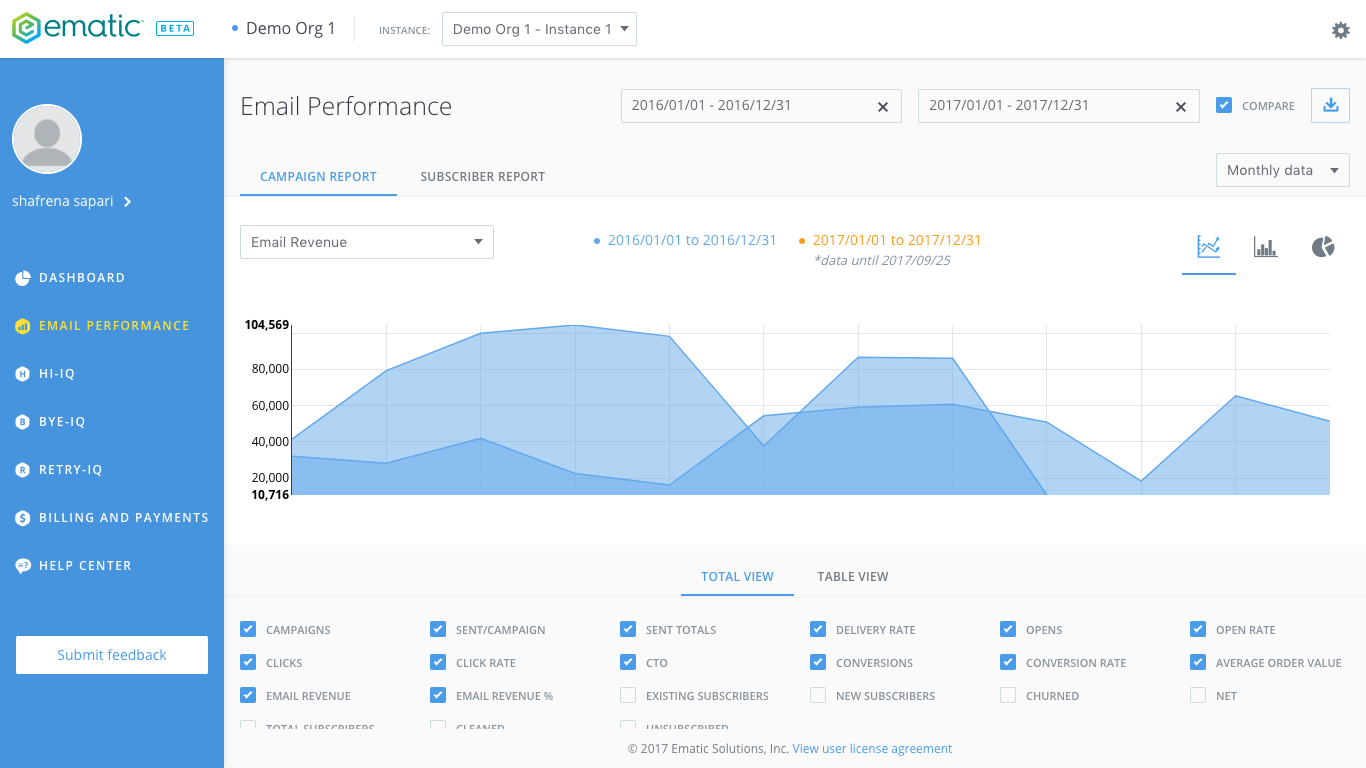
To compare data between 2 different time frame:
- Check the ‘Compare’ box.
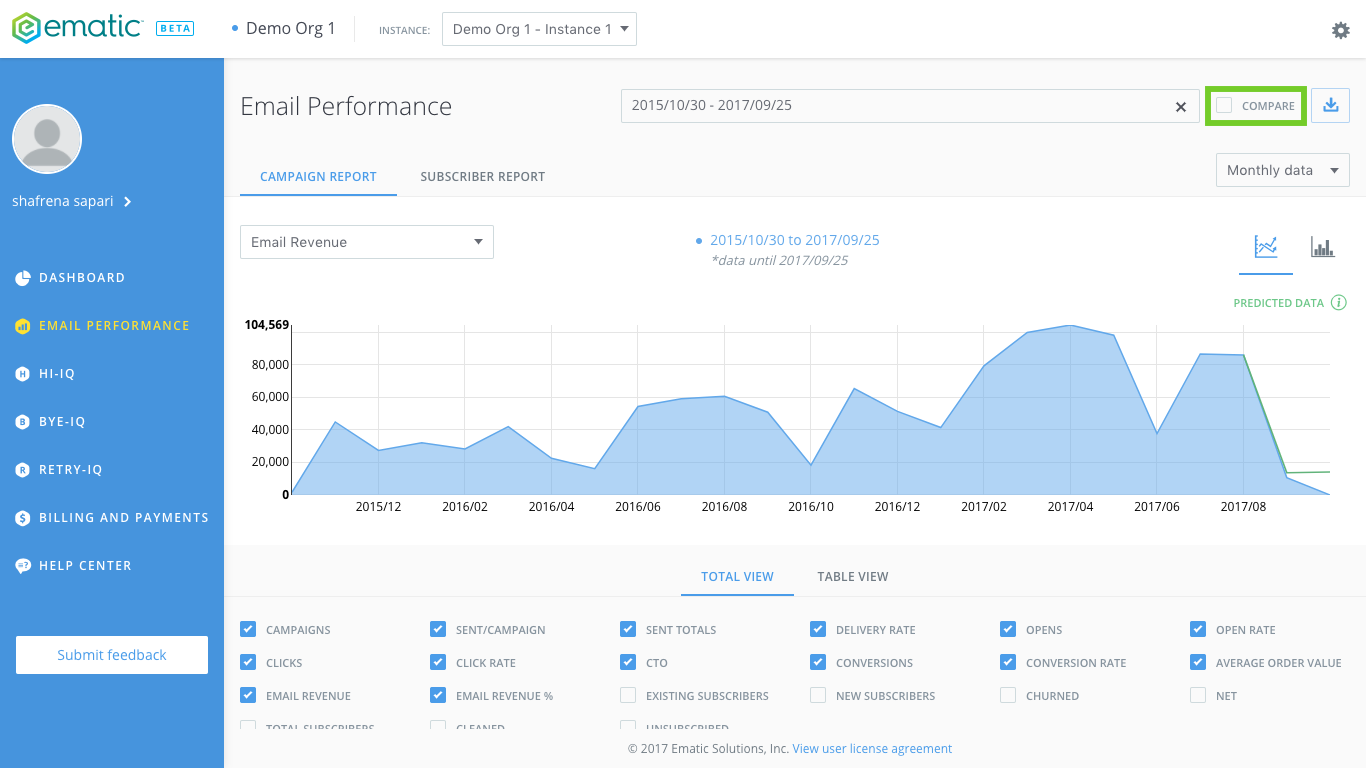
- An additional date drop down menu will appear. Select the time frames that you want to compare with. Click Apply.
- The graph and the data points will be updated with the 2 data populated from 2 different time frames.
Predict data
The Ematic Platform has a unique feature that predicts your future performance based on the your previous performance trends. You will see a green line at the end of your graph as so:
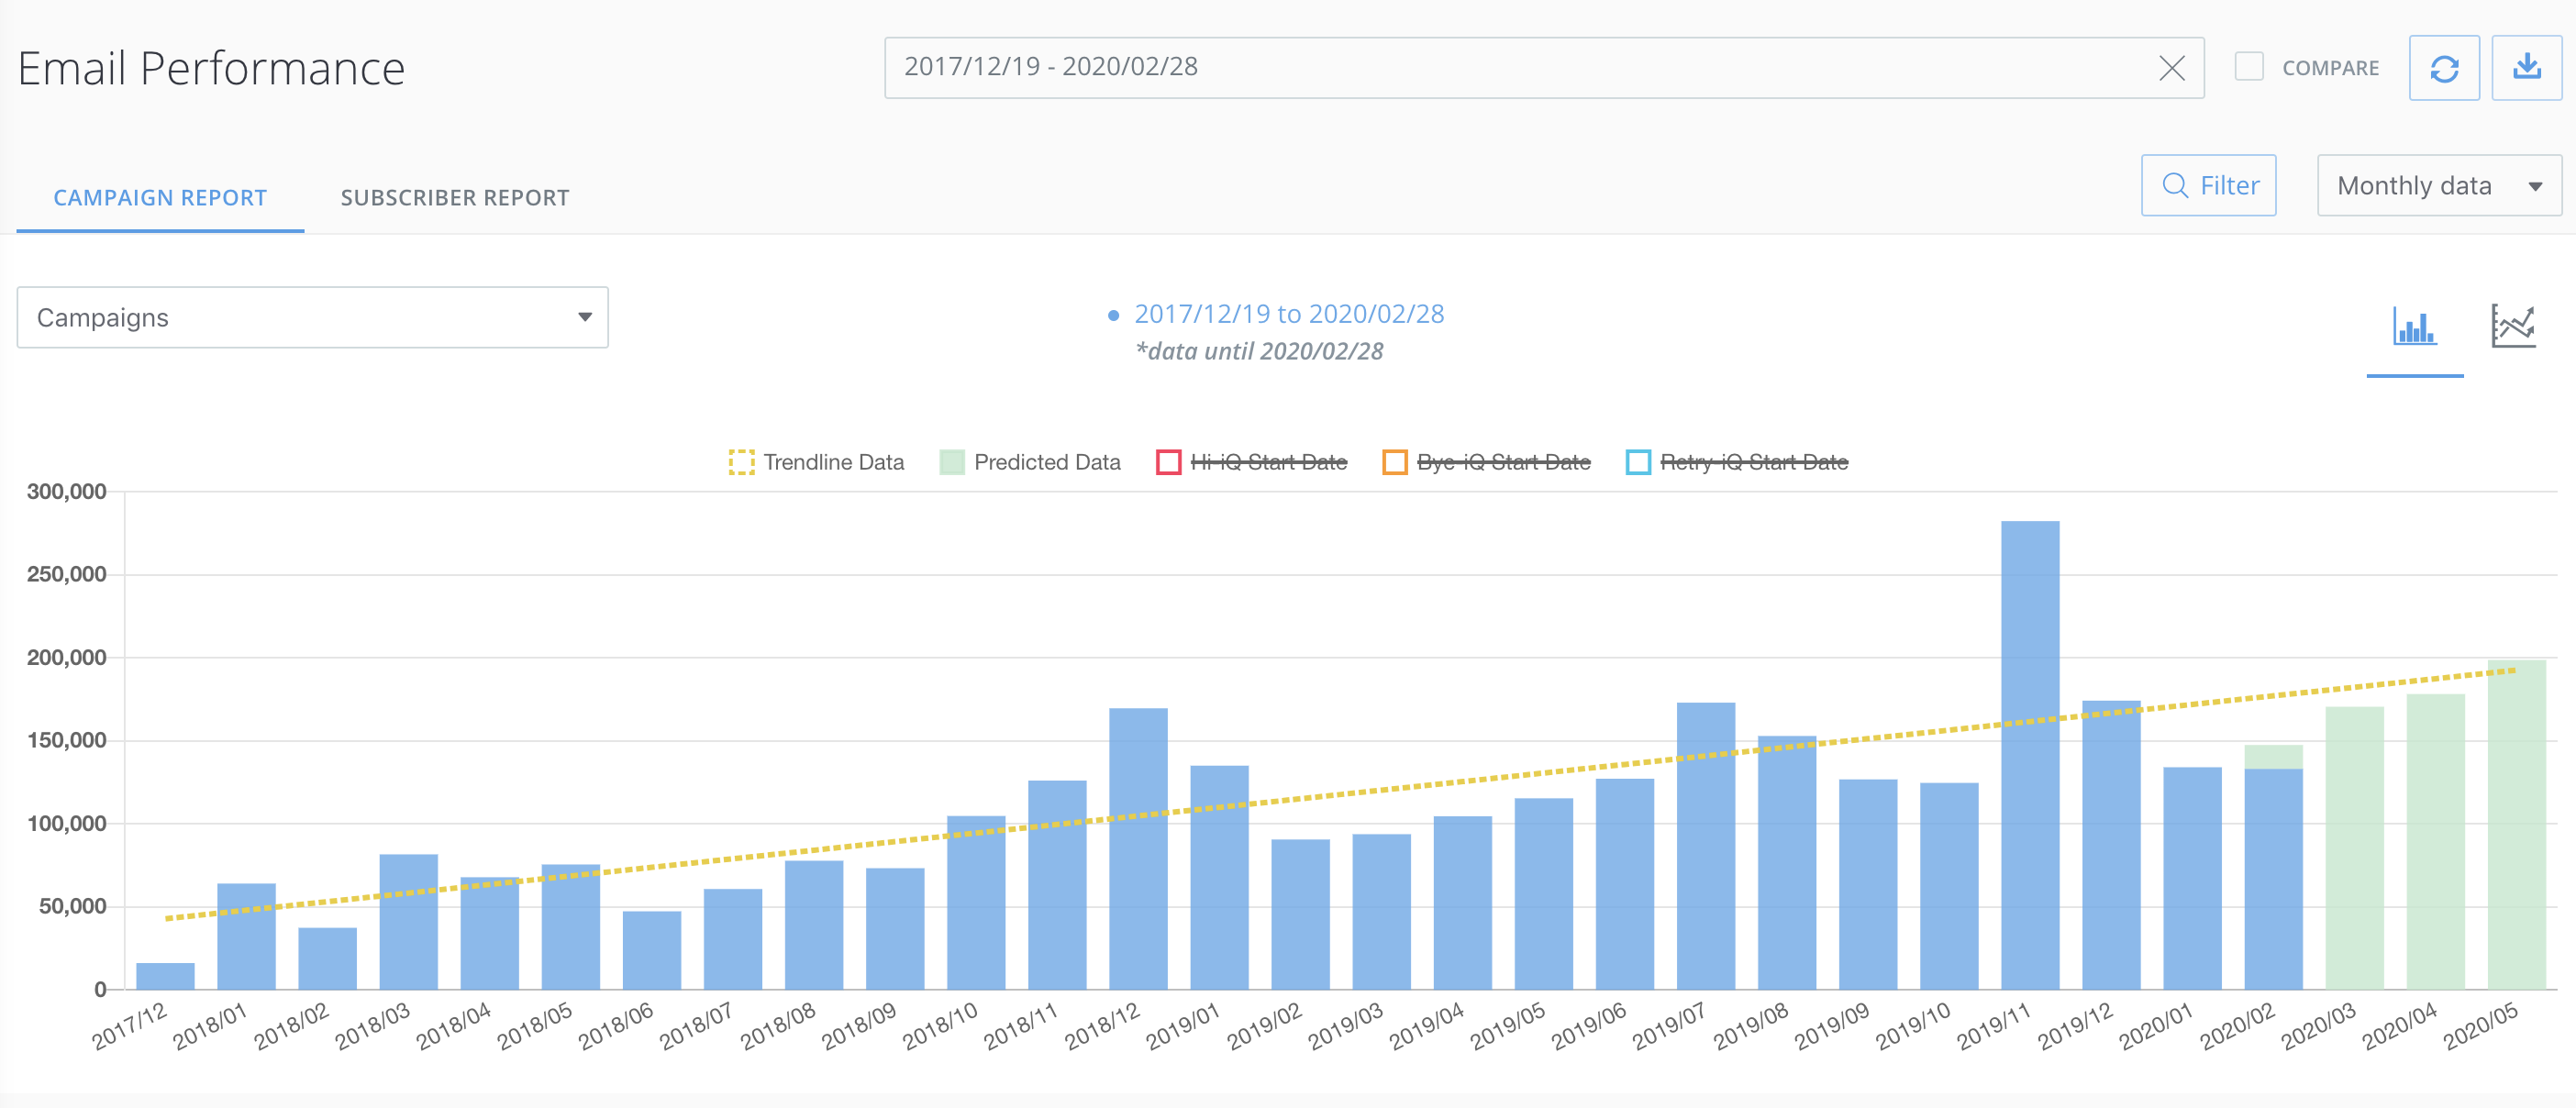
Want to improve and beat the predicted data? Contact support@ematicsolutions.com.
Export data to CSV
- Click on the download icon on the top right.

- Click on Export to CSV and your report can be downloaded
Print or save data to PDF
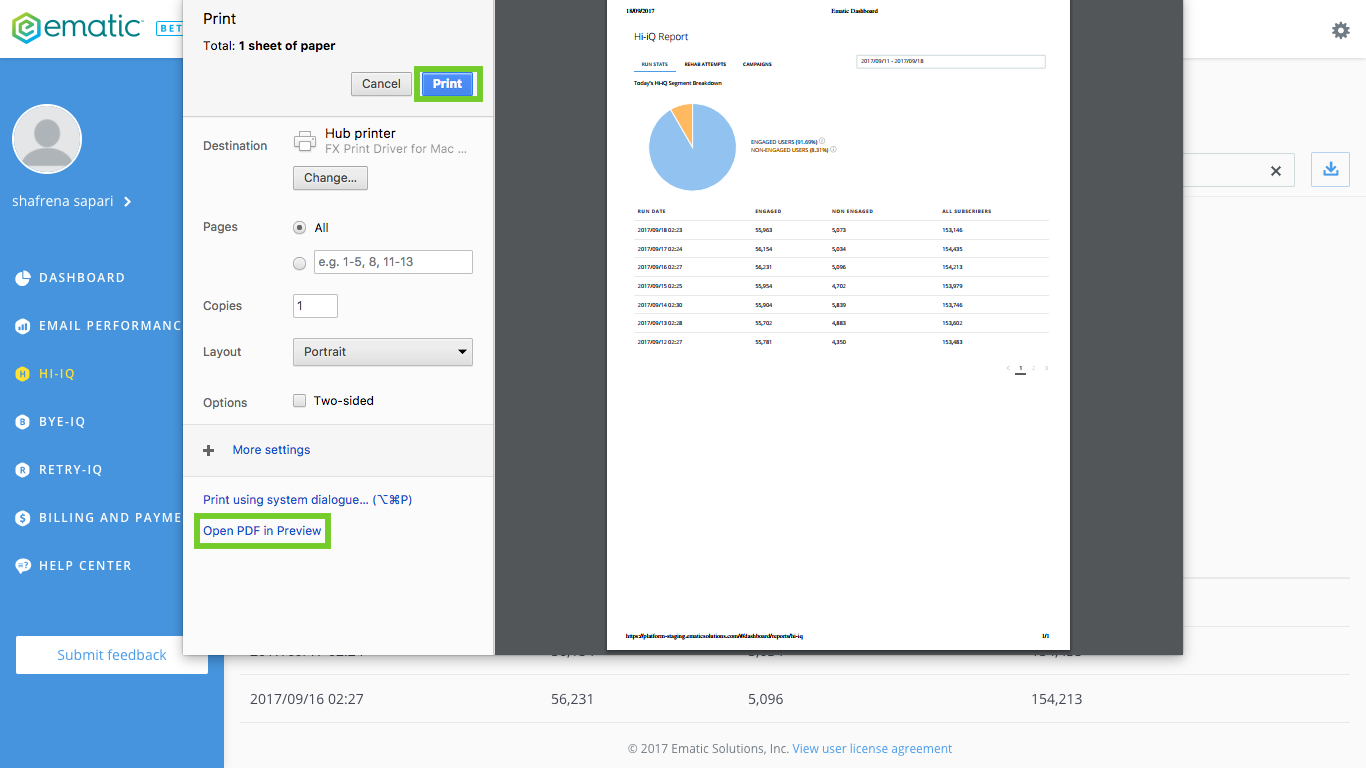
- Click on the download icon on the top right.

- Click on the ‘Print/save to PDF’
- Select the printer or ‘open PDF in preview’
Line graph or Bar chart or Pie chart
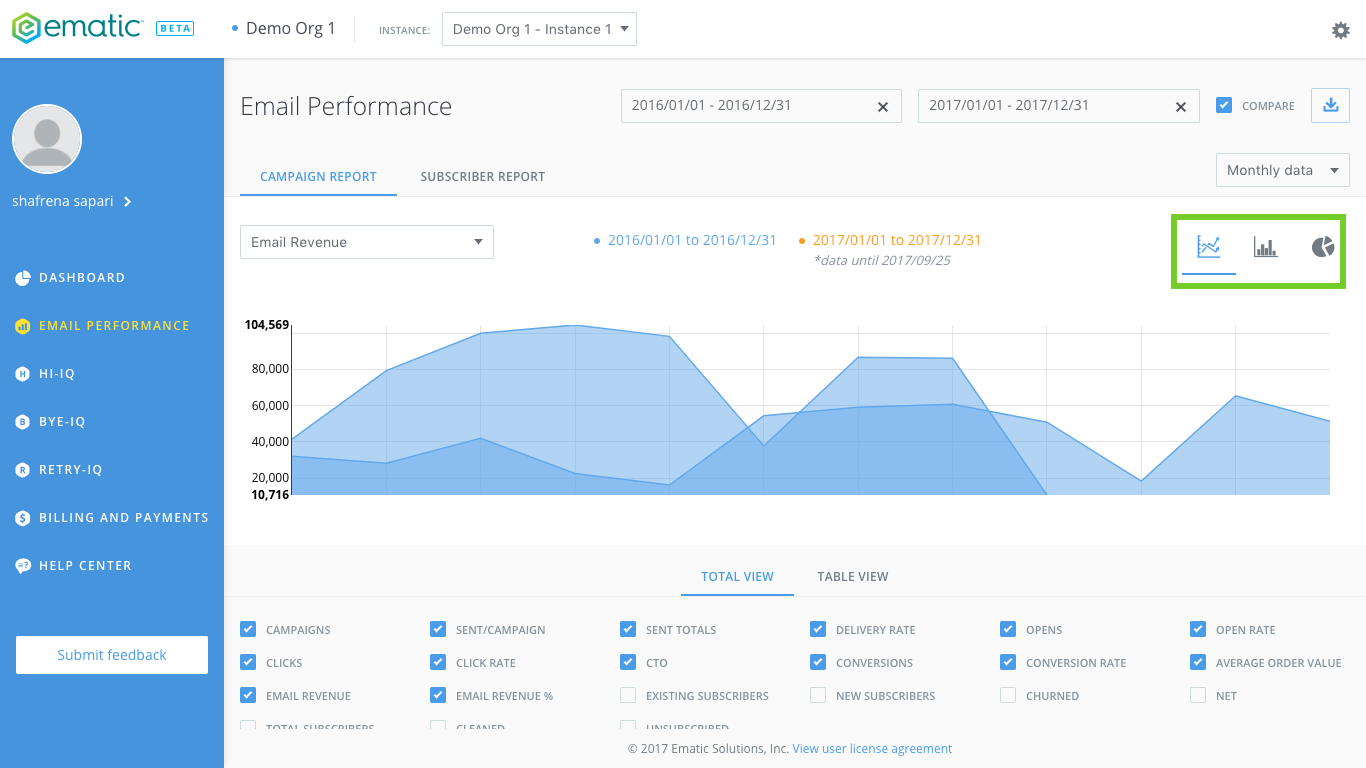
Have the data presented in a line graph or bar chart. Your’s to pick! To do so, click on the diagram:
View relevant data in total view or table view
A set of data points are selected and listed after the graph. You may click add more data points by checking the box next to the data points and watch it appear in the list.
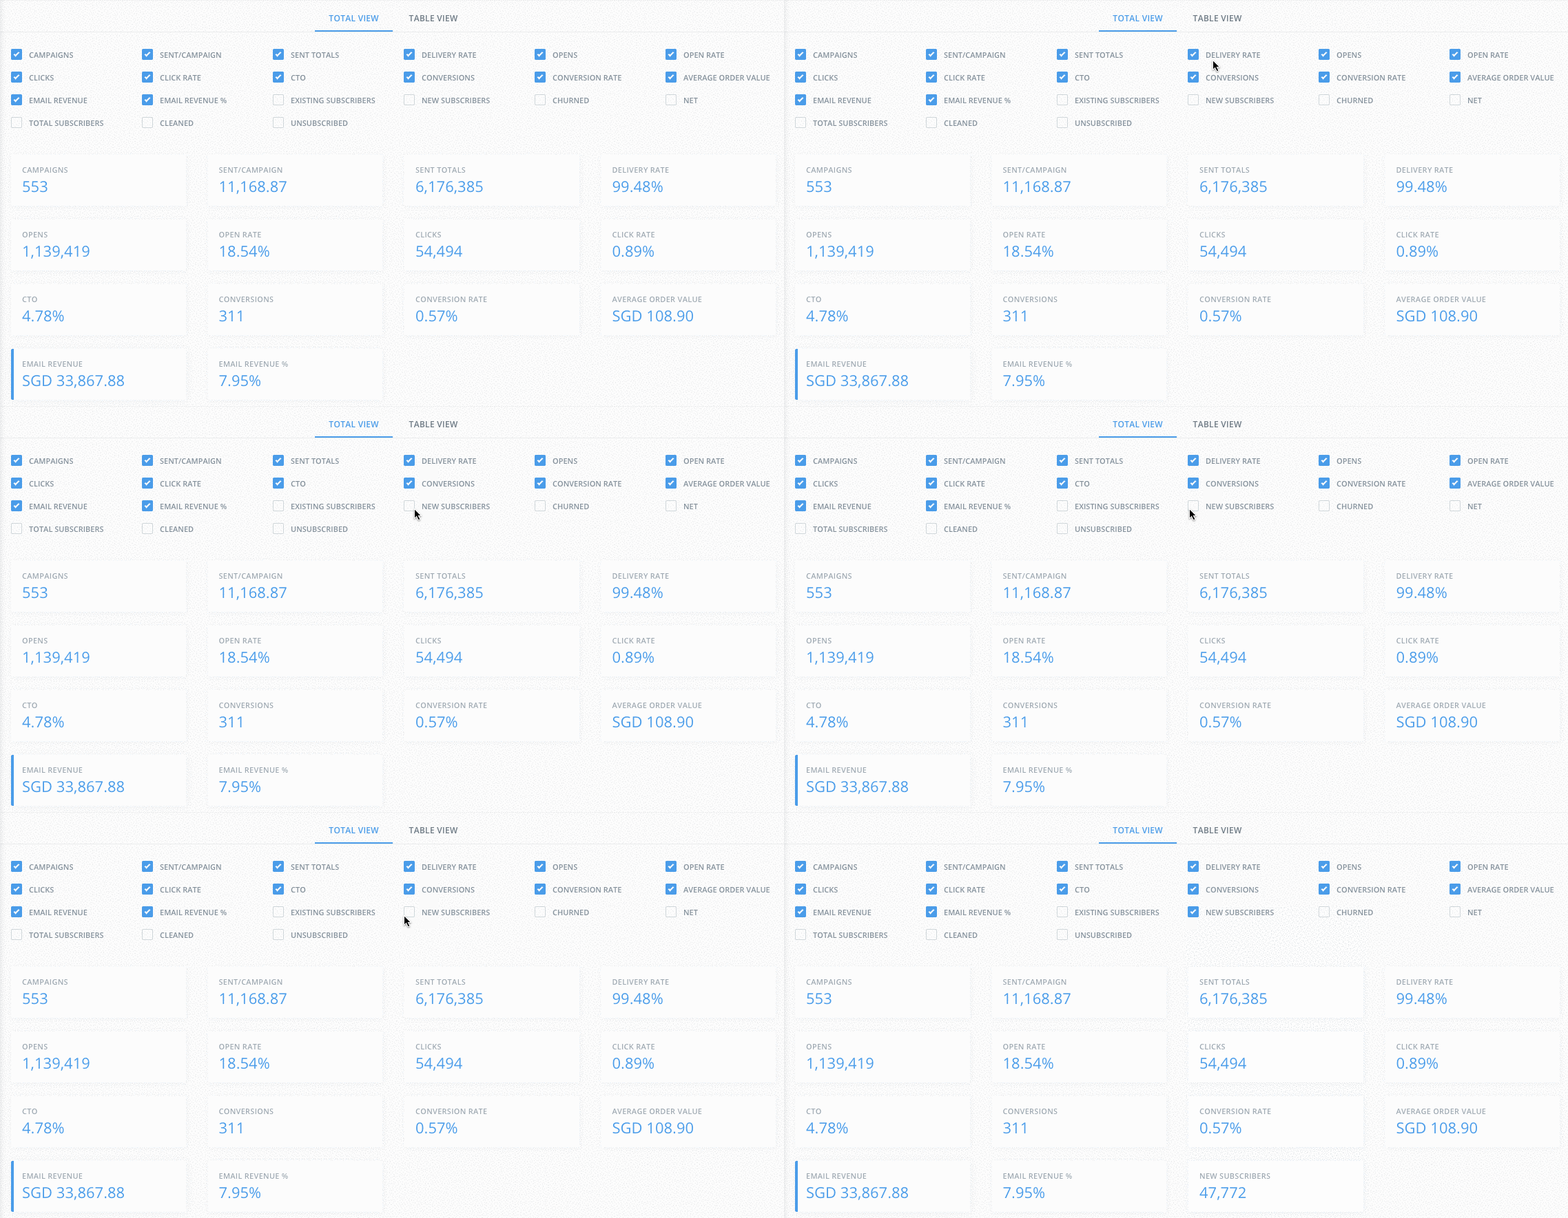
Did You Know: Click on the data point and watch it be projected on the graph.
Other data points
Besides email revenue, the campaign report is a useful tool for projecting other data points to a graph. You may project:
- Campaigns
- Sent/Campaign
- Sent total
- Delivery rate
- Opens
- Open rate
- Clicks
- Click rate
- CTO
- Conversions
- Conversion rate
- Average order rate
- Email Revenue
- Email Revenue %
To do so, click on the drop down menu and watch the graph evolve:
