Bye-iQ Experiment Data
The Experiment Data tab on the Bye-iQ page allow you to monitor the performance of Bye-iQ overlays per trigger set on your website.
It shows the performance in terms of the following:
-
Subscription Rate: The rate of subscription of emails collected via Bye-iQ overlays
-
Eligible: The unique number of users who are eligible to view the overlay
-
Impressions: The total number of times Bye iQ overlay has appeared.
-
Subscribers: Number of email contacts collected via Bye-iQ overlays
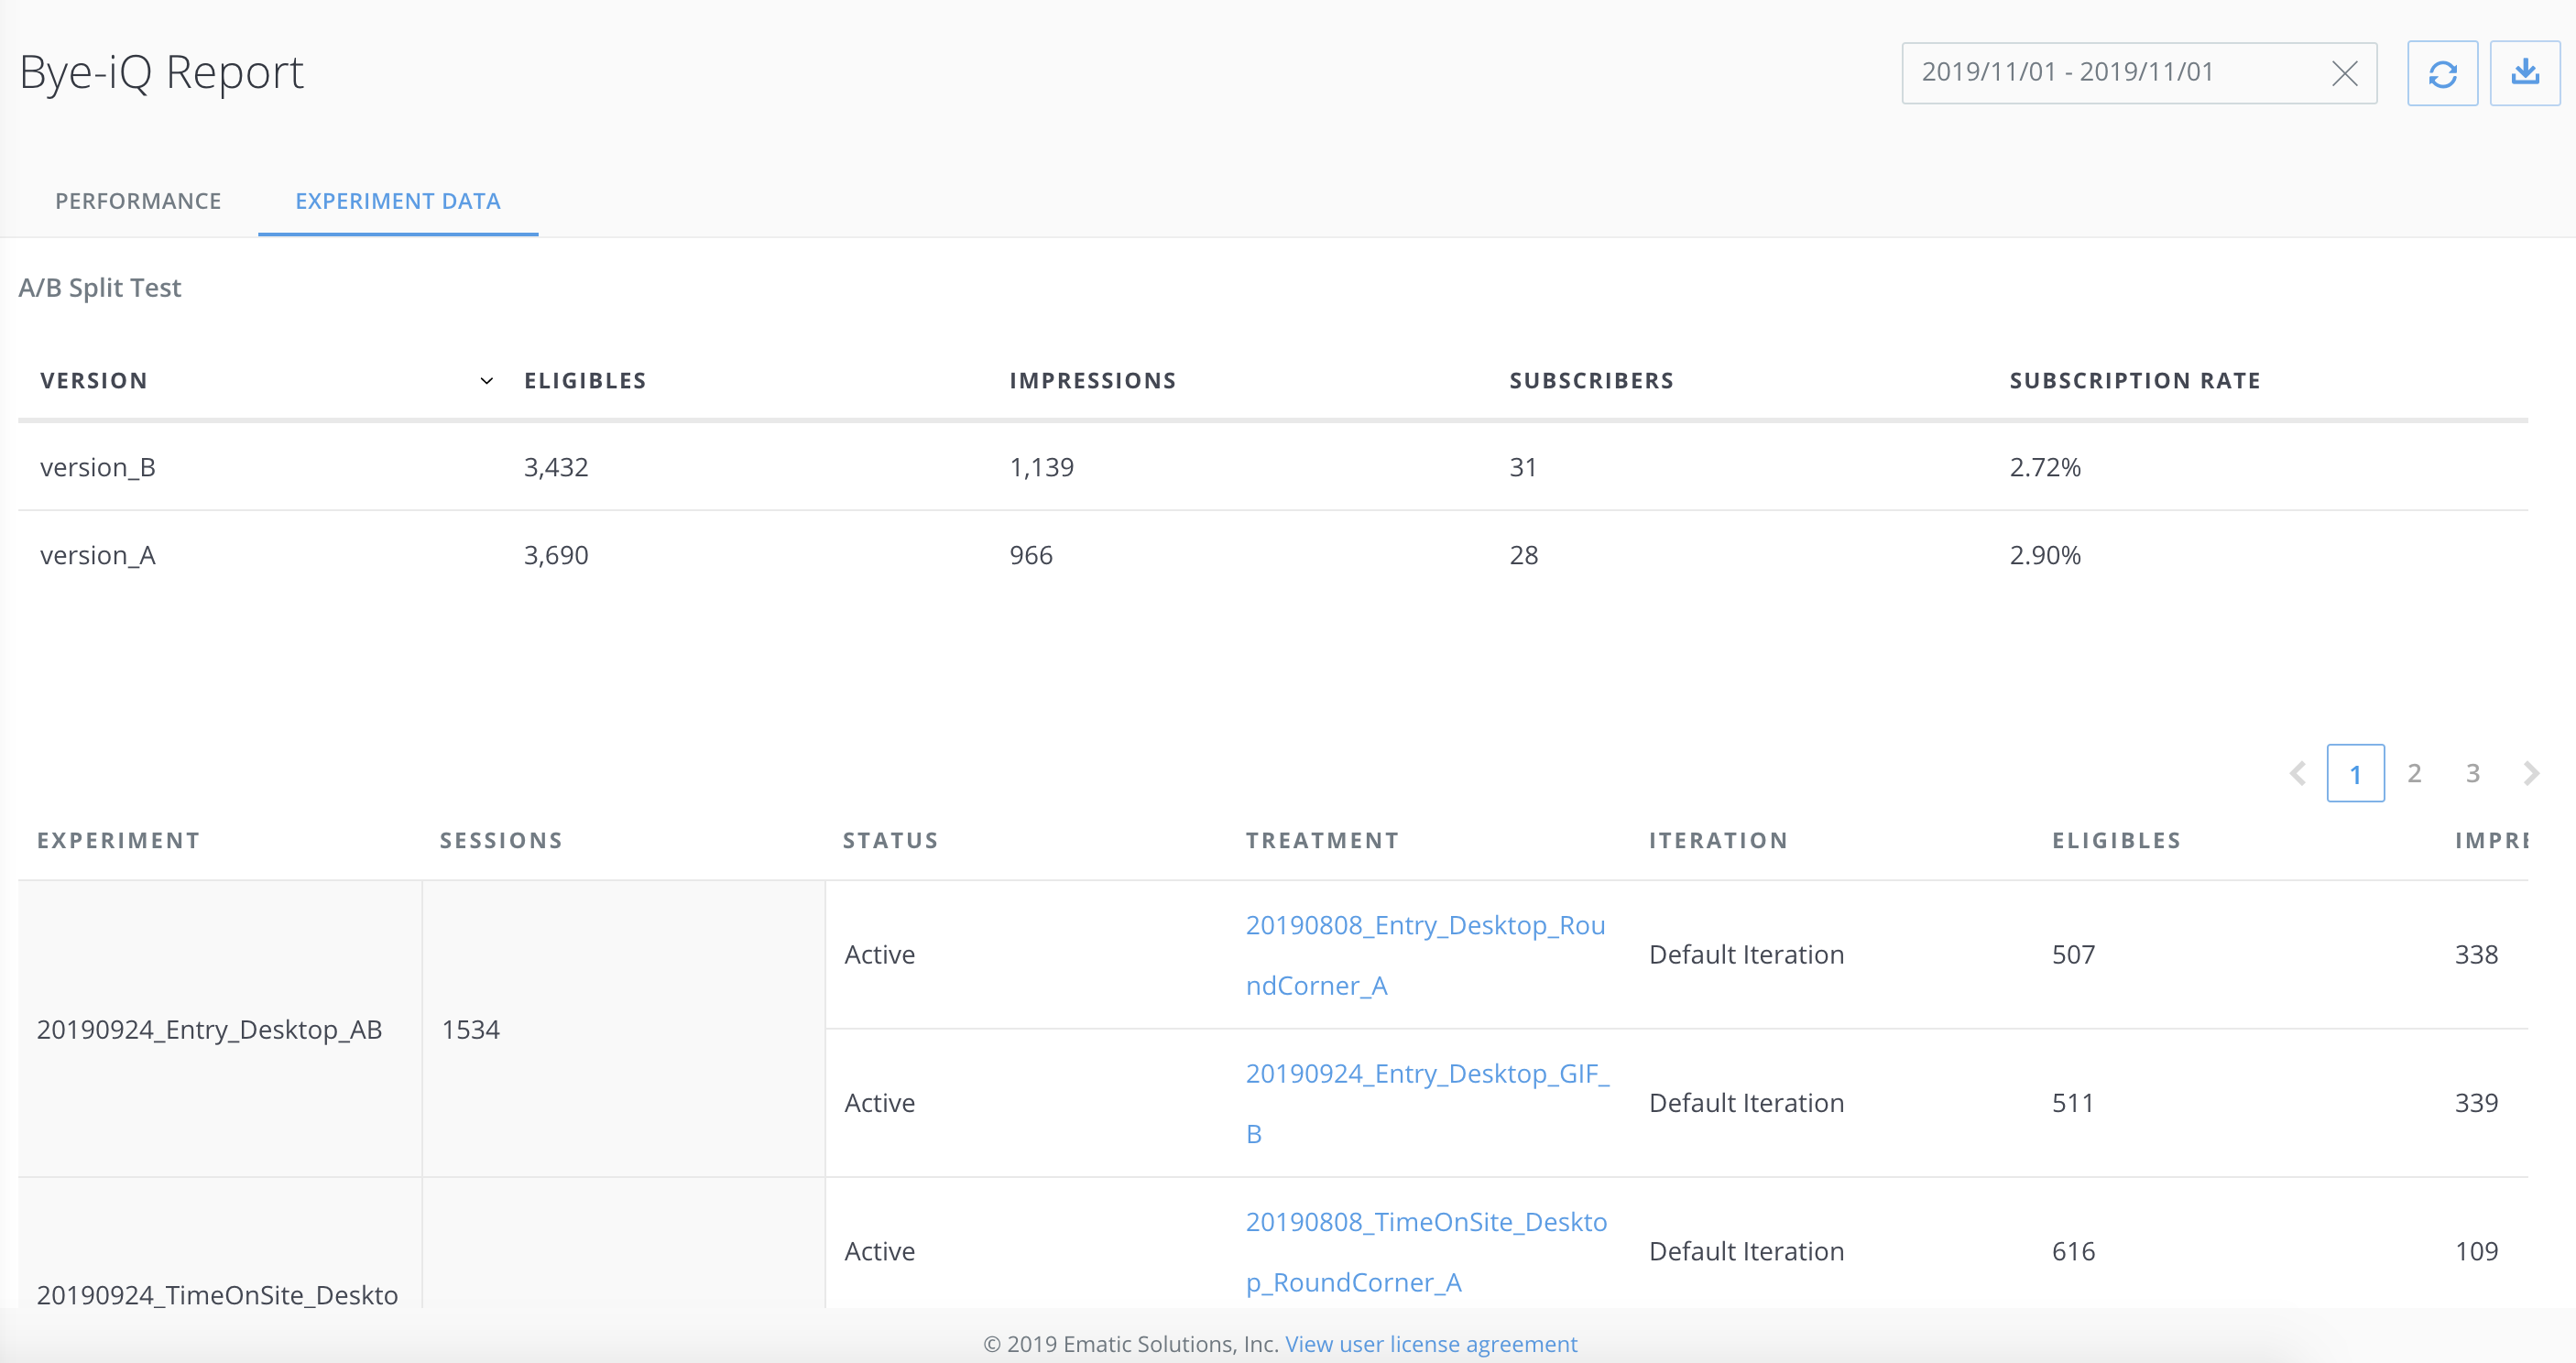
A/B Testing
Bye-iQ enables you to conduct A/B testing or split testing. A/B testing allows you to compare between two different overlays to learn more about your customer’s behaviours. You can monitor the progress of each experiments and it’s A/B testing on this table. Your customer success managers will also be monitoring the progress and will be switching one of the overlays off when there is a winner among them. That way, you’ll get more subscribers almost guaranteed!
The Experiment Data tab also shows you the performance split between the different A/B versions that capture subscribers during the specified timeframe.